Description of geometric indices
Parent vessel geometric characterization
Given the 3D surface model, vessel centerlines are computed for all the available segments and are available for download on the website. Only the tract hosting the aneurysm is used for the geometric characterization.
The segment under investigation is extracted from the complete centerline network by identifying the bifurcations and separating the branches. The main bifurcation on the analyzed segment is used for the computation of angles.
The same geometric characterization can be performed for each vessel segment and for each bifurcation.
Here's a detailed description of the geometric parameters uploaded.
Vessel Length
Length of a single vascular tract after separation into branches (Figure1-A).
References: Piccinelli et al, TMI, 2009.
Mean, Minimum and Maximum Radius
The value of the radius is given point-wise along all the segments as computed directly during the centerlines extraction (Figure1-B). Mean, minimum and maximum values are provided for the single tract under analysis.
The vessel radius is estimated as the maximum inscribed sphere radius at each single location along the centerline, which basically matches the radiological convention of measuring the minimum radius (or diameter) over a range of possible angiographic projections (Figure1-C and D).
References: Antiga et al, Med Biol Eng Comput, 2008; Piccinelli et al, TMI, 2009.
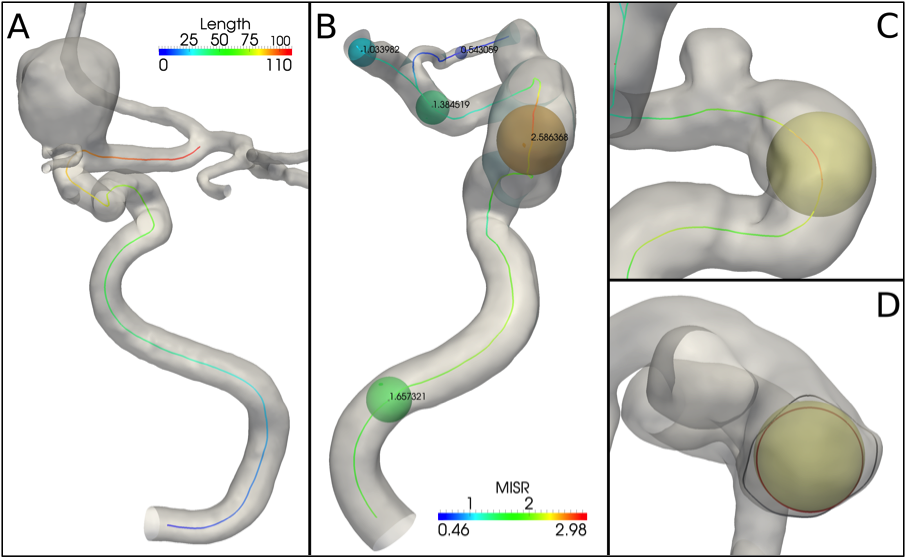
Figure 1. (A) Example of ICA siphon centerline length calculation; (B) vessel radius estimation performed within the centerlines extraction; MISR= maximum inscribed sphere radius; (C) different lateral projection to show the maximal sphere tangent to the model boundary; (D) view from the top down showing at the same position of C the cross section border (red) of the inscribed tube (i.e. envelope of all maximal spheres) and the vessel cross section border (black).
Mean and Maximum Curvature
The curvature parameter is computed point-wise on the tract under analysis and the mean and maximum values are provided (Figure 2-A).
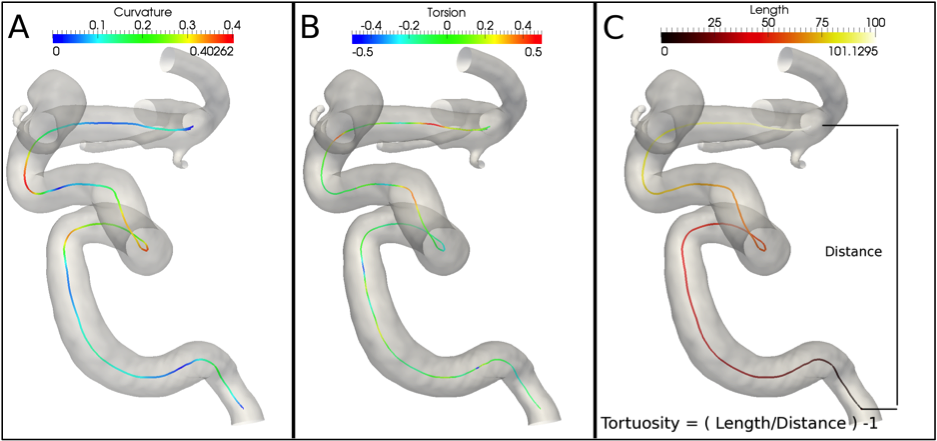
Figure 2. Centerline point-wise curvature (A) and torsion (B) along an ICA siphon centerline. (C) Tortuosity definition as the ratio between the length of the centerline and the Euclidean distance between endpoints.
A centerline curvature at a certain location quantifies its deviation from a straight line. At a given point, the curvature is the inverse of the radius of the osculating circle that locally approximates the curve. The osculating circle lies on a plane, the osculating plane (Figure 3-A and -B).
References: Piccinelli et al, TMI, 2009.
Mean and Maximum Torsion
The torsion is computed point-wise on the tract under analysis and the mean and maximum values are provided (Figure 2-B).
Torsion measures how sharply the curve is twisting in space. Torsion quantifies the rate of rotation of the osculating plane in the point neighborhood (Figure 3-A and -B).
References: Piccinelli et al, TMI, 2009.
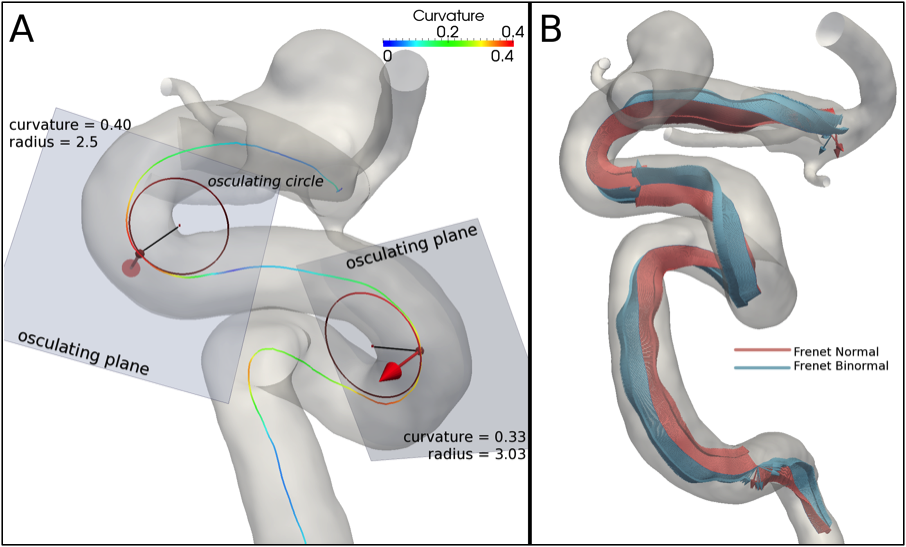
Figure 3. (A) At each centerline point the curvature is defined as the inverse of the radius of the osculating circle that lies on the local osculating plane. (B) Frenet Frame normal and binormal unit vectors along the centerline: the normal unit vector points towards the center of the osculating circle, while the binormal unit vector defines the osculating plane.
Tortuosity
The tortuosity of a curve measures its deviation from being a straight line in terms of length. Being computed as the line length over the Euclidean distance between its endpoints, it basically quantifies its increment for not being rectilinear (Figure 2-C). References: Piccinelli et al, TMI, 2009.
Bifurcation Angles
Once the bifurcation is identified, a local bifurcation reference system is defined in terms of origin and plane onto which the bifurcation lies. Two unit vectors are available: normal vector, i.e. the plane normal, and an up-normal vector, i.e. vector lying on the plane, directed downstream. Bifurcation angles are calculated between the directions of the vascular tracts entering and leaving the bifurcation area by projecting them onto the plane (In-Plane Bifurcation Angle) and perpendicularly to the plane (Out-Of-Plane Angle).
References: Antiga and Steinman, TMI, 2004; Piccinelli et al, TMI, 2009.
Aneurysmal Sac Geometric Characterization
The characterization of the aneurysmal sac is performed once it has been isolated from the parent vasculature along the identified aneurysm neck cross section, also indicated in the following as ostium section (Figure 4-A).
References: Ford et al, BJR, 2009; Piccinelli et al, Annals Biomed Eng, 2012.
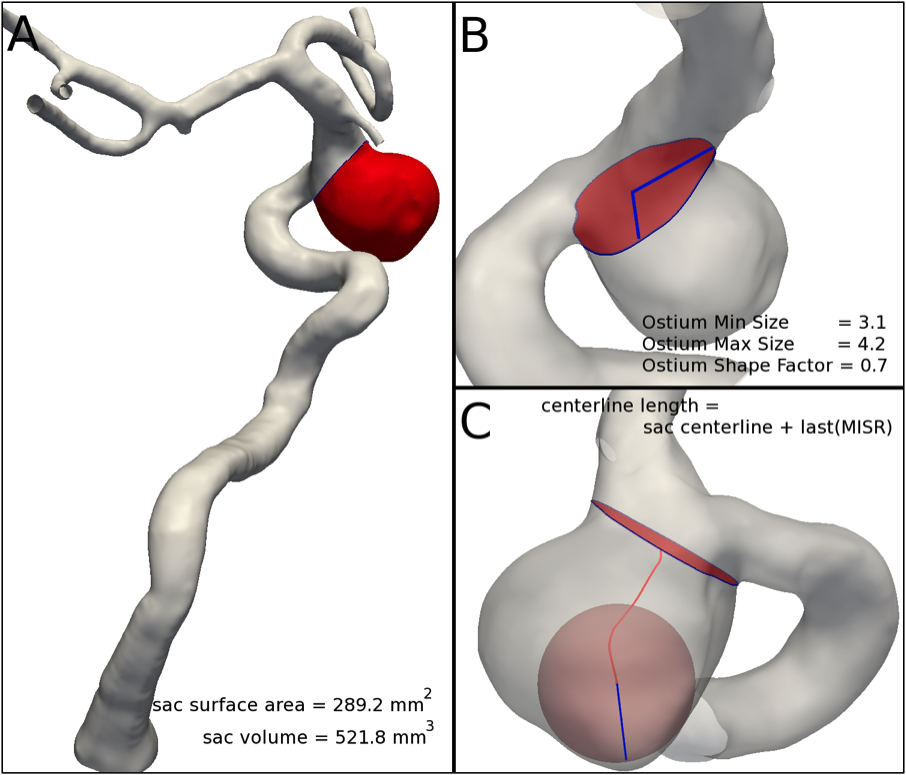
Figure 4. (A) Isolation of the aneurysmal sac from the parent vasculature; sac volume and surface area are readily computable; (B) ostium cross section separating the sac from the parent vessel: area, perimeter length, minimum and maximum size from the barycenter and shape factor can be computed; (C) sac centerline definition: the radius of the last maximal sphere has to be added for a correct estimation of the 3D sac centerline length.
Ostium Section Area and Perimeter
The ostium is the planar section that best separates the vasculature from the aneurysmal sac. Once the region at the interface between sac and parent vessels has been identified, the neck or ostium is defined as the first closed section for which the area has a local minimum. Its area and the length of its perimeter are calculated (Figure 4-B).
References: Piccinelli et al, Annals Biomed Eng, 2012.
Ostium Minimum, Maximum Size and Shape Factor
The ostium section barycenter is calculated and the minimum and maximum distance from the section border measured. The ratio between Minimum and Maximum size is a number between zero and one that quantifies the deviation of the section shape from a circle (Figure 4-B).
References: Piccinelli et al, Annals Biomed Eng, 2012.
Sac Centerline Length
This is the geometric parameter proposed by our group to measure the aneurysm sac height. We employ the 3D sac centerline to measure the length of the aneurysm sac without constraining it to be a straight line, but following its shape. The radius of the maximal inscribed sphere associated with the furthest point of the extracted centerline is added for a correct measure of the 3D sac length (Figure 4-C).
References: Piccinelli et al, Annals Biomed Eng, 2012.
Sac Surface Area and Volume
Once isolated from the parent vasculature, the aneurysm sac surface area and volume can be readily calculated (Figure 4-A).
Voronoi Diagram Core (VDC) Envelope Surface Area and Volume
Within our framework for a 3D geometric characterization of the aneurysmal sac, the Voronoi Diagram Core was defined as the portion of the VD whose vertices are associated with a radius greater than 75% of the maximum value. The VDC envelope represents a smaller portion of the sac that includes its essential shape features. Once the VDC envelope is extracted, its surface area and volume are also computed (Figure 5).
References: Piccinelli et al, Annals Biomed Eng, 2012.
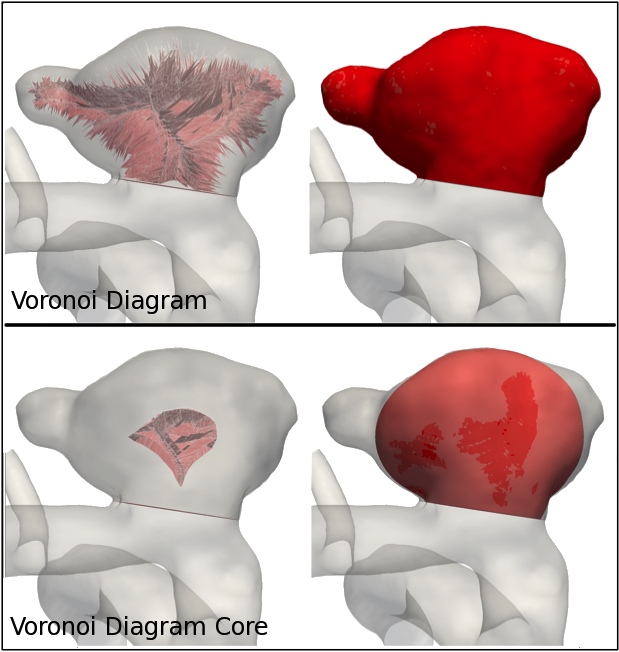
Figure 5. Comparison between Voronoi Diagram and Voronoi Diagram Core and their respective envelopes.
Maximum Inscribed Ellipsoid (MIE) Volume
As an additional quantification of the dimensions of the sac, the maximum ellipsoid inscribed in its shape is defined and its volume calculated (Figure 6).
References: Piccinelli et al, Annals Biomed Eng, 2012.
MIE Maximum, Mid and Minimum Semi-Axis
The MIE semi-axes are also provided to quantify the aneurysm dimensions along orthogonal directions. Although the semi-axes cannot account for all complex sac features, they can provide a robust methodology for shape classification (Figure 6).
References: Piccinelli et al, Annals Biomed Eng, 2012.
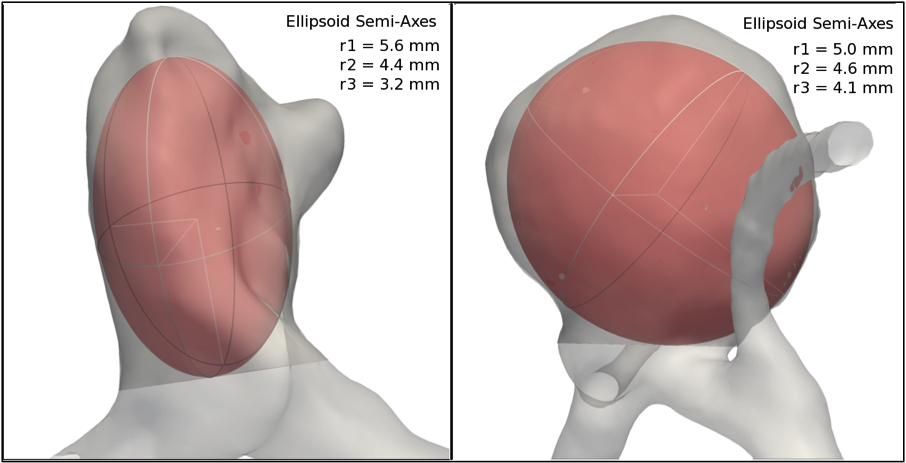
Figure 6. Computation of maximum inscribed ellipsoid and representation of its semi-axis for two very different aneurysmal sac shapes. The semi-axes may be used as a simple metric to classify aneurysm shapes.
Vessel Diameter
An average parent vasculature diameter value is computed at specific locations along the involved vessels close to the aneurysm, i.e. clipping points. For side-wall aneurysms only the location upstream the aneurysm is used, while locations along the common branch and both daughter arteries are employed for terminal aneurysm configurations (Figure 7-A and C).
References: Piccinelli et al, Annals Biomed Eng, 2012.
Aneurysm Orientation Angles
To describe the spatial relationship between aneurysm and parent vasculature, three unit vectors are defined: usac, defined as the direction of the straight line connecting the ostium barycenter to the most distal point of the sac centerline; uneck, the normal to the ostium section; uvessel, identifying the parent vessel direction as the tangent to the vessel centerline at the upstream clipping point for side-wall aneurysms and at the common branch clipping point for terminal aneurysms.
The aneurysm bifurcation plane is defined; the unit vectors are projected onto the aneurysm bifurcation plane and the angle between neck and parent vessel, Neck-Vessel Angle, and between sac and parent vessel, Sac-Vessel Angle, computed (Figure 7-B and D).
References: Piccinelli et al, Neurosurgery 2011; Piccinelli et al, Annals Biomed Eng, 2012.
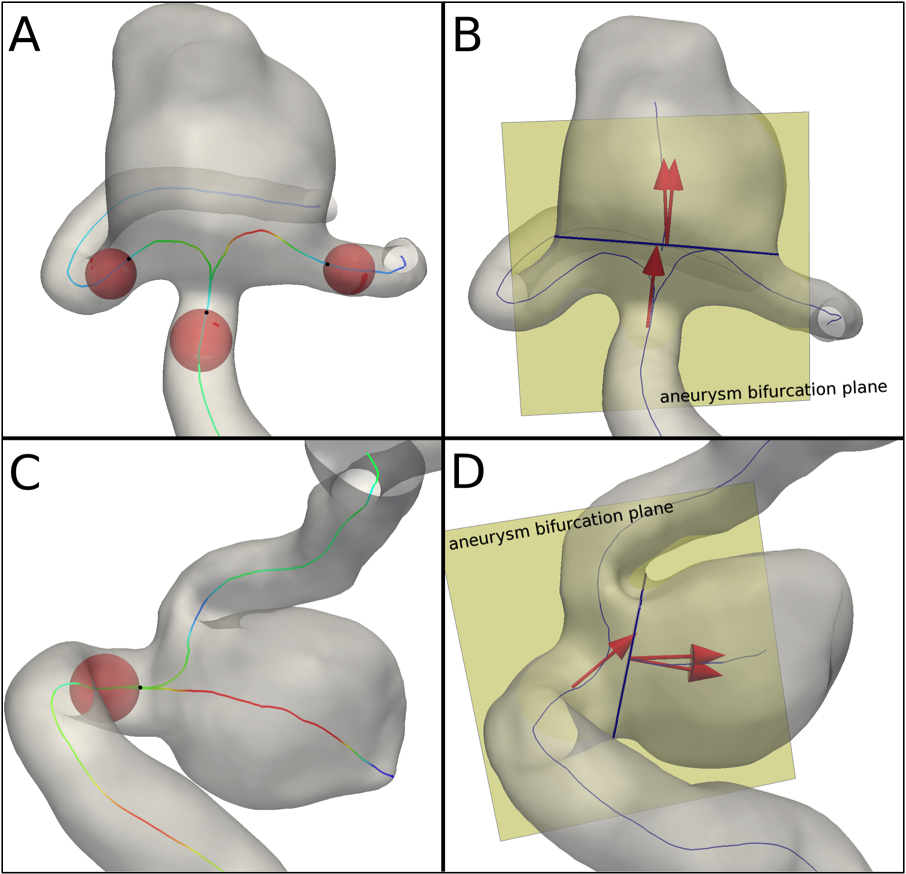
Figure 7. Definition of the regions for the calculation of the parent vasculature average diameter for terminal (A) and side-wall (C) configurations; black points are the clipping points. Projections of unit vectors usac, uneck and uvessel onto aneurysm bifurcation plane for terminal (B) and side-wall (D) configurations.
Aspect Ratio*
Adapting the common definition of aspect ratio as the ratio between aneurysm height over ostium diameter, we use the sac centerline length as a measure of aneurysm height.
References: Ujiie et al, Neurosurgery, 1999; Piccinelli et al, Annals Biomed Eng, 2012
Size Ratio*
Modified version of the size ratio parameter defined as the sac maximum height over the parent vasculature diameter. In our version the sac centerline length is used as a measure of sac maximum height.
References: Dhar et al, Neurosurgery, 2008; Piccinelli et al, Annals Biomed Eng, 2012